 Previous Page Next Page
In the process of designing a report, you can preview it at any time. JReport Designer supports previewing reports in JReport format. For page reports and web reports, you can also preview them in formats such as HTML, PDF, Excel and so on.
When previewing a report,
To preview a report in JReport format, just click the View tab, which will cause the JReport Engine to run the report (for details about the options in the View tab, see Design/View Area). The result is then shown in the viewer. To optimize performance, JReport Designer displays report pages before they have been completely generated.
Previewing library components
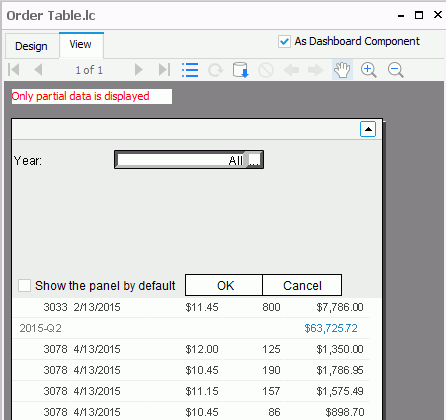
When previewing a library component in JReport format, by default only the result of the data component in the library component is displayed. The other parts like the configuration panel cannot be previewed. If you want to preview the effect when the library component is published to JReport Server and inserted into a dashboard, check the As Dashboard Component checkbox on the top-right corner of the View tab, then the title bar of the library component will be shown and you can click  on the title bar to display the configuration panel of the library component and preview the objects in it.
Previewing 2-D bar, bench, line, area and stock charts
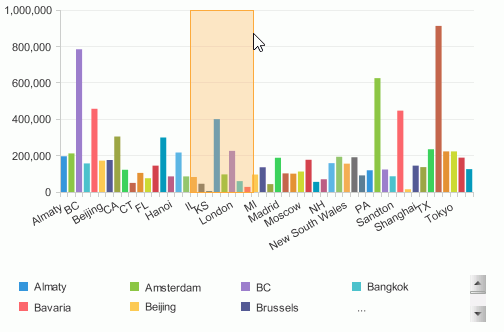
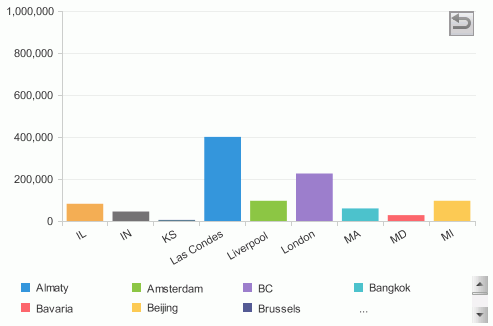
When previewing a 2-D chart of the Bar, Bench, Line, Area or Stock type in JReport format, you can select the values you are interested in to have them zoomed.
Previewing banded objects in page reports
When previewing a banded object in a page report in JReport format, you are able to dynamically sort the records and show details of aggregate level fields.
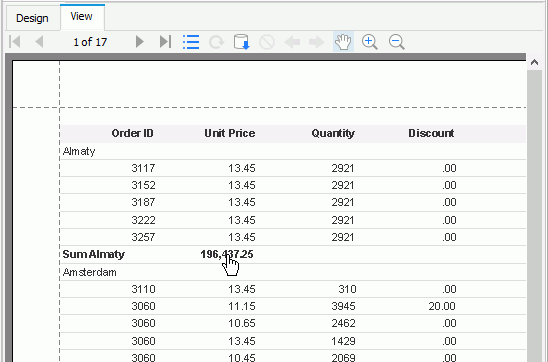
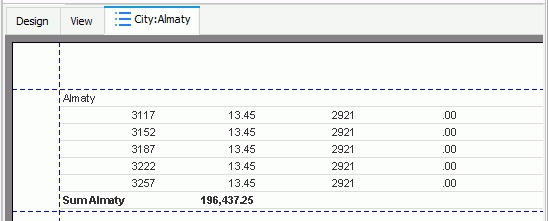
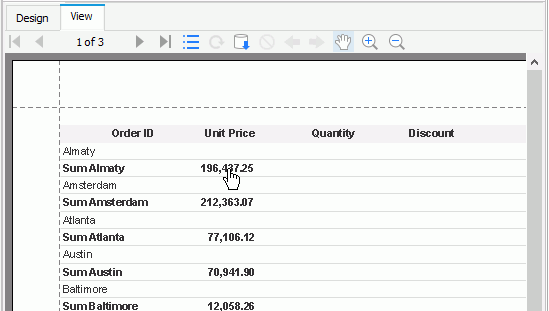
By default, in cases like the above, JReport's convention is to hide the detail panel of each group and only show it in a detail report. To do this, select the detail panel, go to the Report Inspector and set its Invisible property to true (make sure the Suppress property is false). Then view the banded object again, and it will be shown without details. If you want to see the details of a certain city, point the mouse at the city's total sales, when the mouse turns into a small hand, click on the total, and the detail report for the city will be displayed.

Tip: After some modifications in the design area, if you find the report is shown very quickly and the changes are not applied in view mode, this means you need to click the Refresh Data button  on the toolbar to re-run your report.
For page reports and web reports, JReport also allows you to preview them in the following formats: Page Report Result/Web Report Result, HTML, PDF, Excel, Text, RTF, XML and PostScript. To do this, click View > Preview As and then select a format from the drop-down menu. If Page Report Result/Web Report Result is selected, the report will be opened in Page Report Studio/Web Report Studio. When any of the other formats is selected, the report will be exported to a temporary file of the selected format which will then be automatically opened with the appropriate application. The temporary file will be removed when you exit JReport Designer. If you want the file to be saved so that you can review it at any time, use the Export feature instead.
You should pay attention to the following when using the Preview As feature:
-Djreport.url.encoding=UTF-8 in the startup batch file and this setting covers URL encoding/decoding. Therefore, when you preview a report in Page/Web Report Result format, if the name of the report or its report or catalog file contains non-Latin characters, you need add -Djreport.url.encoding=UTF-8 into the startup batch file of JReport Designer as well; otherwise the preview will fail. <install_root>\server\bin.<install_root>\server\lib directory, modify the udo.ini file in <install_root>\server\lib and append the classes to the class path of JRServer.bat in <install_root>\server\bin (make sure that the path of the file JREngine.jar is before that of the file report.jar).<install_root>\server\bin.