 Previous Page Next Page
This dialog appears when you right-click an activity gauge of a chart in a report and select Format Activity Gauge from the shortcut menu. It helps you to format an activity gauge.
The dialog contains the following tabs: Circular Graph, Pointer, Target, Frame, Range Color and Behaviors (the Behaviors tab is available to charts in library components only).
Sample
Displays a preview sample of your selection.
OK
Applies the changes and closes the dialog.
Cancel
Does not retain any changes and closes the dialog.
Apply
Applies all changes and leaves the dialog open.
Help
Displays the help document about this feature.
Specifies the properties for arcs in the activity gauge.
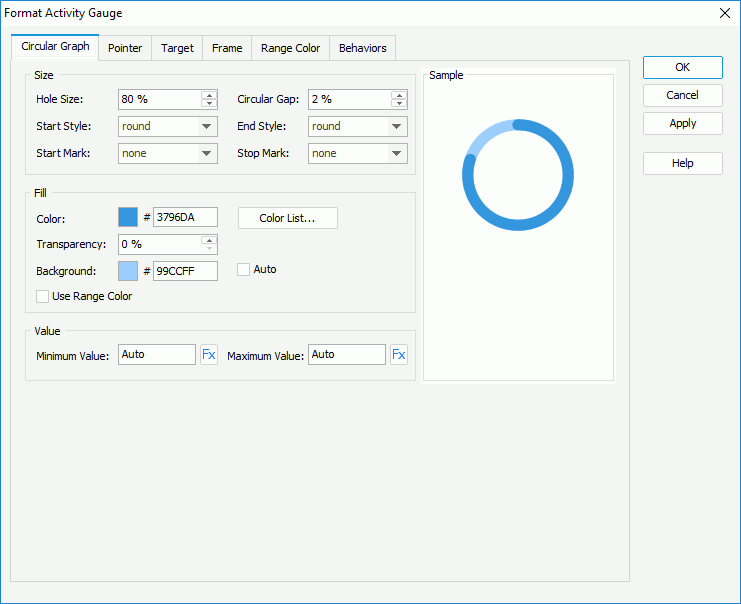
Size
Specifies the size of the arcs.
Fill
Specifies the color of the arcs.
Value
Specifies the values to be displayed in the chart.
Specifies properties of the pointers in the activity gauge.
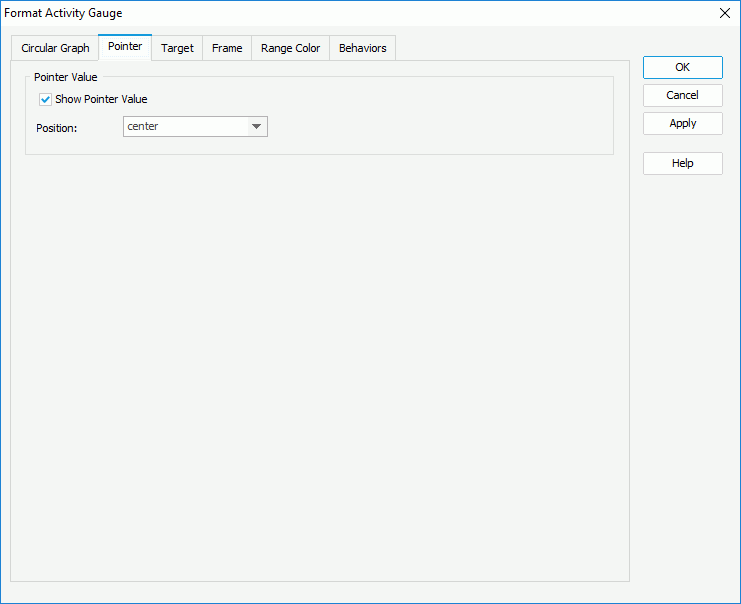
Pointer Value
Specifies the pointer value properties.
Specifies properties of the target in the activity gauge.
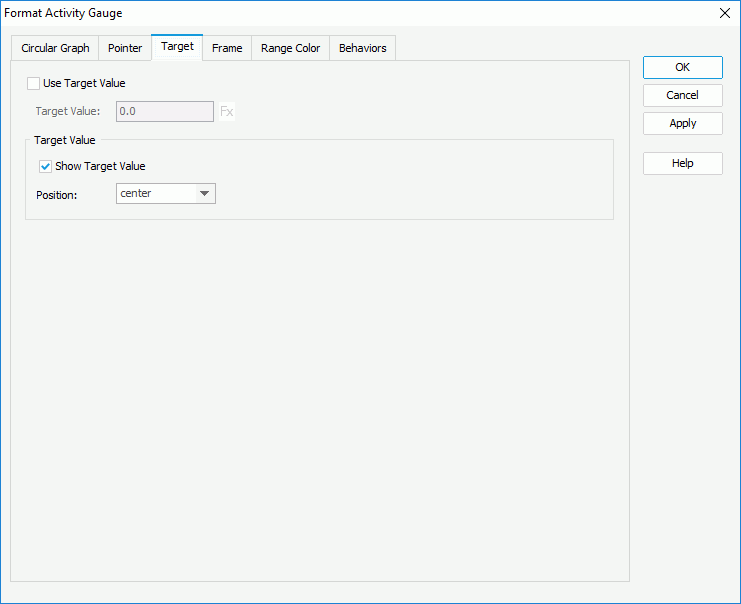
Use Target Value
Specifies whether to use the target value for the activity gauge.
Target Value
Specifies properties of the target value.
Specifies properties for the frame of the activity gauge chart.
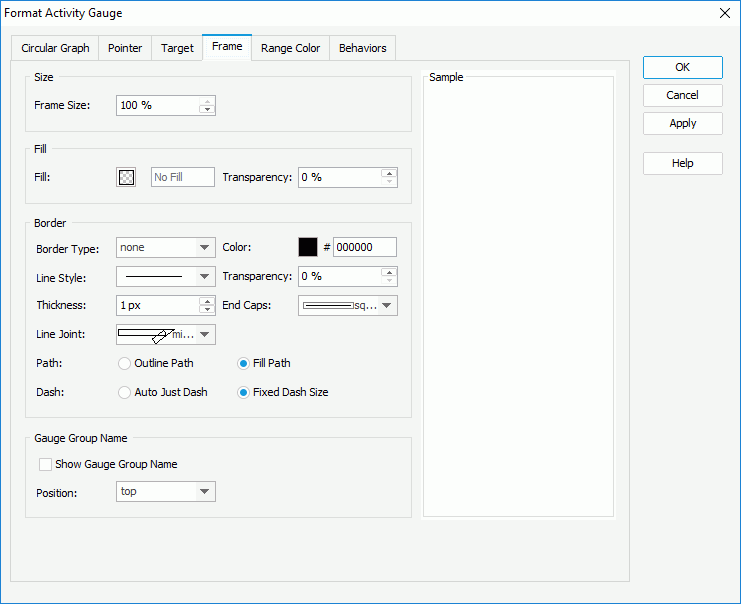
Size
Specifies the size properties of the frame.
Fill
Specifies the color and transparency of the frame.
Border
Specifies properties for border of the frame.
End Caps
Specifies the ending style of the border line.
Path
Specifies the fill pattern of the border line.
Gauge Group Name
Specifies properties for the gauge group name.
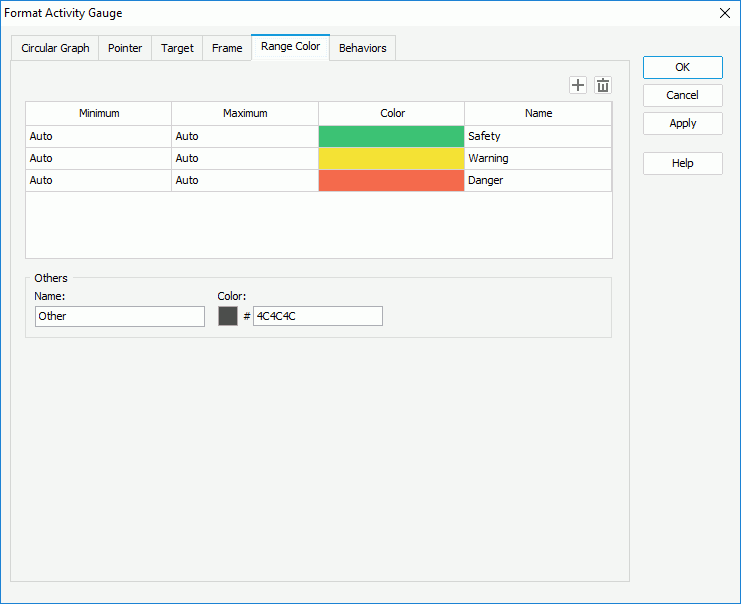
Specifies different colors to fill the arcs in activity gauge in different ranges.

Adds a new color range.

Removes the selected color range.
Minimum
Specifies the minimum value of the range.
Maximum
Specifies the maximum value of the range.
Color
Specifies the color schema of the range. Click in the color cell to customize the color on the color palette.
Name
Displays the name of the range.
Others
Specifies the properties for values that do not fall into any of the ranges you define.
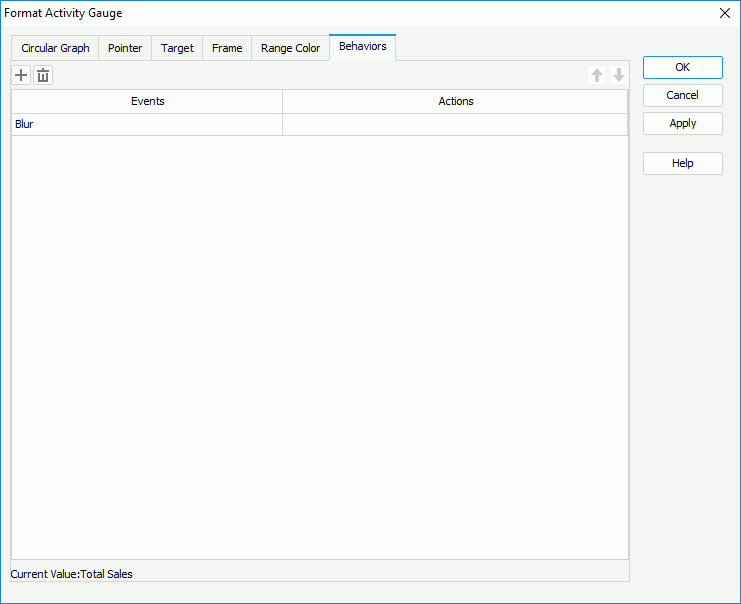
Specifies some web behaviors to the activity gauge. This tab is only available to charts in library components.

Adds a new web behavior line.

Removes the selected web behavior.

Moves the selected web behavior up a step.

Moves the selected web behavior down a step.
Events
Specifies the trigger event.
Actions
Specifies the action you want the event to trigger.
