 Previous Page Next Page
With the table wizard, it is easy to create tables in a report, however the wizard varies with the data resource type used for the table: business view or query resource.
A web report and library component can only use business views. For a page report it can be created either based on query resources or business views, which is determined at the time when the page report is created by the Create Using Business View option. Once defined, all the data components in the page report can only be created on the specified data resource type.
A table can be inserted in the report areas listed in Component placement. When a table is inserted into a banded object in a page report, you can use a data container link to define the relationship between the table and its parent.
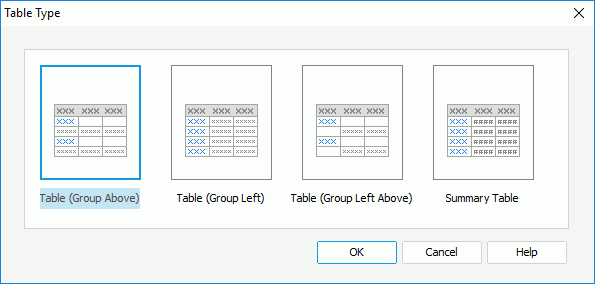
The Create Table wizard appears, which contains a set of screens for helping you define a table easily. You can use the Back and Next buttons or click the screen name on the screen navigation bar to switch between the screens. When creating a table in a web report or library component, you will get different screens according to the selected table type: group table or summary table.
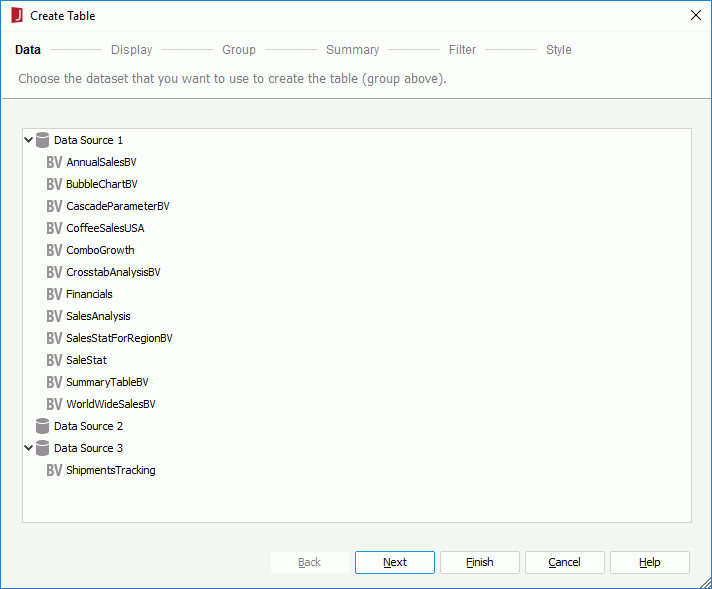
To define the data for a group table in a web report/library component, or for a table in a page report:
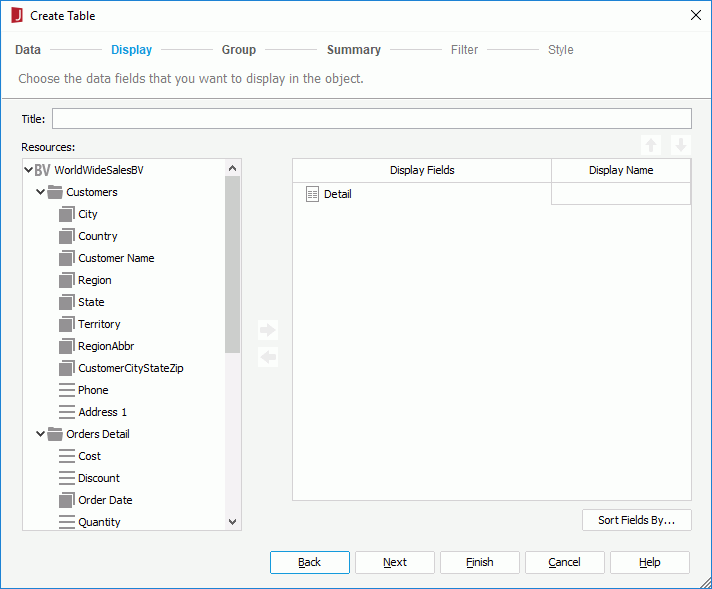
The Resources box lists the data objects that can be used as detail fields in a table. These objects include: group objects  and detail objects
  in the specified business view, dynamic formulas used as Group
  and dynamic formulas used as Detail
  created for the business view in the current report.
To add a detail field, select an object in the Resources box, then click  or drag and drop it to the right box; to remove an unwanted detail field, select it and click
  or drag and drop it to the Resources box. To adjust the display order of the detail fields in the table, make use of
  and
and  . By default the display names of the added objects will be used to label the corresponding detail columns; to edit the label text for a detail column, click in the Display Name text box and enter a new one; if you want to automatically map the label text to the dynamic display name of the field at runtime, check the Auto Map Field Name checkbox in the text box. If needed, click the Sort Fields By button to specify in which manner to sort the detail values.
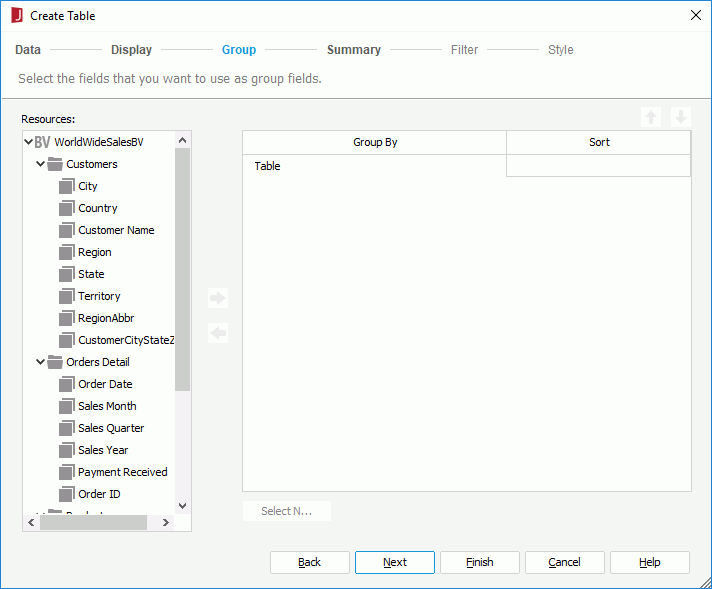
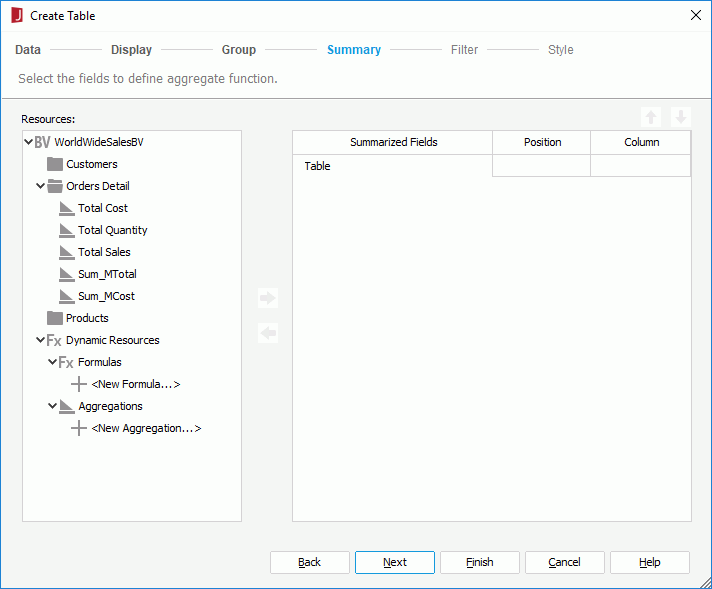
 in the specified business view, as well as the dynamic formulas used as Aggregation
  and dynamic aggregations
  created for the business view in the current report. You can add them as summaries to calculate data in the table.
To add a summary in the table, in the right box select the group to which the summary will be applied (if you select Table, it will be based on the whole business view), select an object in the Resources box and click  or drag and drop it to the right box. You can add several summaries for any group level; to adjust the display order of the summaries in a group or move a summary to another group, make use of
  or
or  . The Position and Column options work together to determine the positions of the summaries in the table.
To define the data for a summary table in a web report/library component:
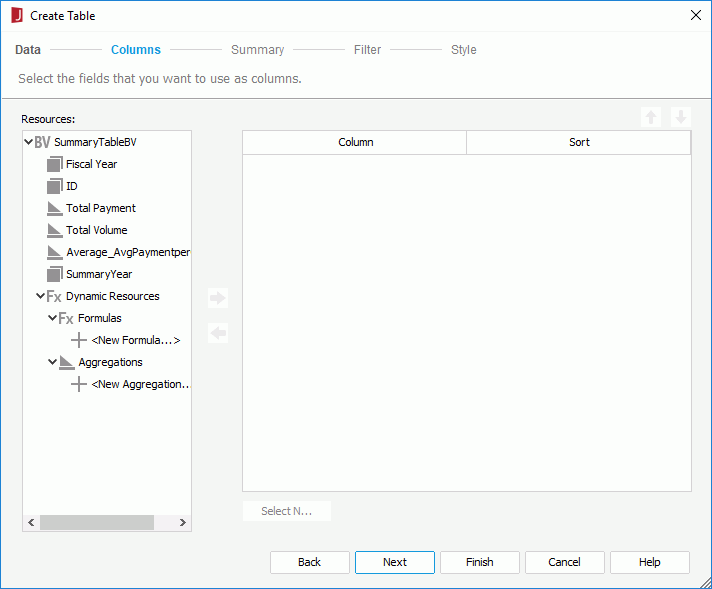
 and aggregation objects
  in the specified business view, as well as the dynamic formulas used as Group
  , dynamic formulas used as Aggregation
  and dynamic aggregations
  created for the business view in the current report. You can create columns in the table from these objects.
To add a column, select an object in the Resources box and click  or drag and drop it to the right box; to remove an unwanted column, select it and click
  or drag and drop it to the Resources box. Click
  or
or  to adjust the display order of the columns. The table will be automatically grouped by the added group objects and the position of the group objects in the right box determines the group level: the topmost group object the highest group level and the lowest group object the innermost group level. All the aggregation objects are parallel and calculate based on the innermost group. For any group level, you can customize its sort manner and define Select N condition to show data of certain range in its groups.
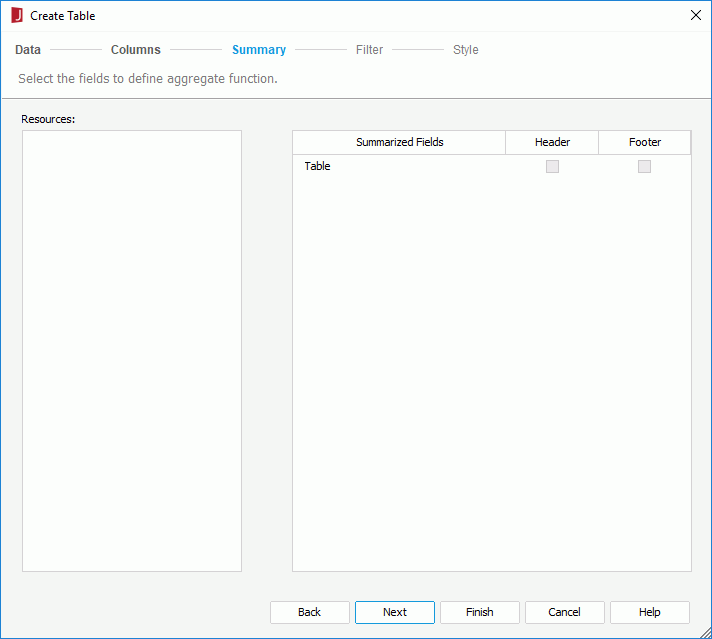
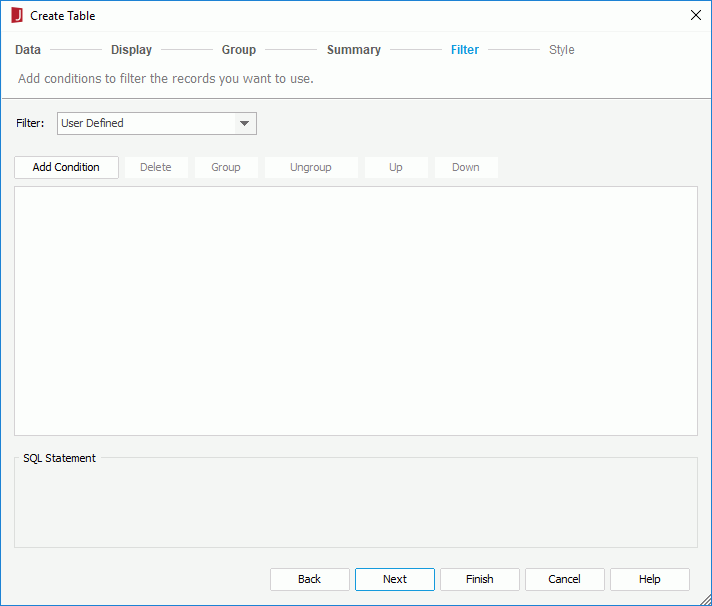
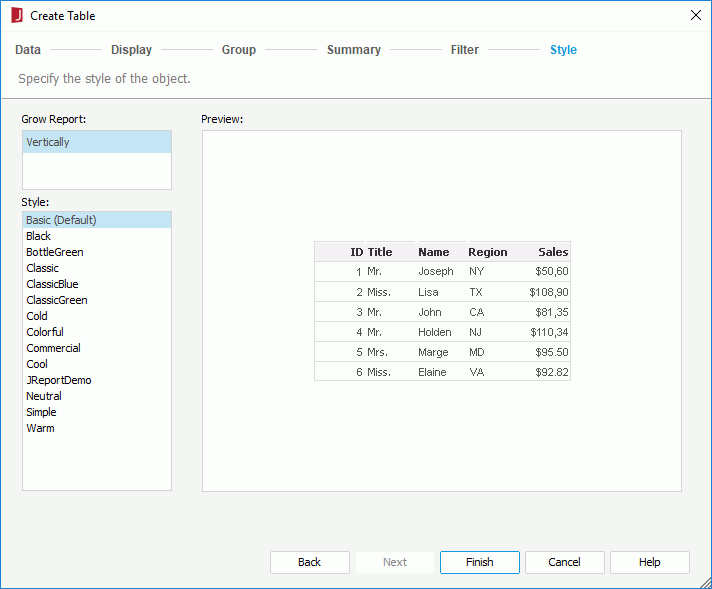
When you have specified to insert the table into a banded object, by default the table will inherit its parent's style. If you want to apply another style to the table, uncheck the Inherit Style option and then select the required style from the Style box.
If you have used the menu tab command to insert the table and selected a panel in a banded object as the table destination, after clicking Finish in the wizard, you need to click the mouse button in the destination once again in order to insert the table there.
The Create Table wizard appears, which contains a set of screens for helping you define a table easily. You can use the Back and Next buttons or click the screen name on the screen navigation bar to switch between the screens.
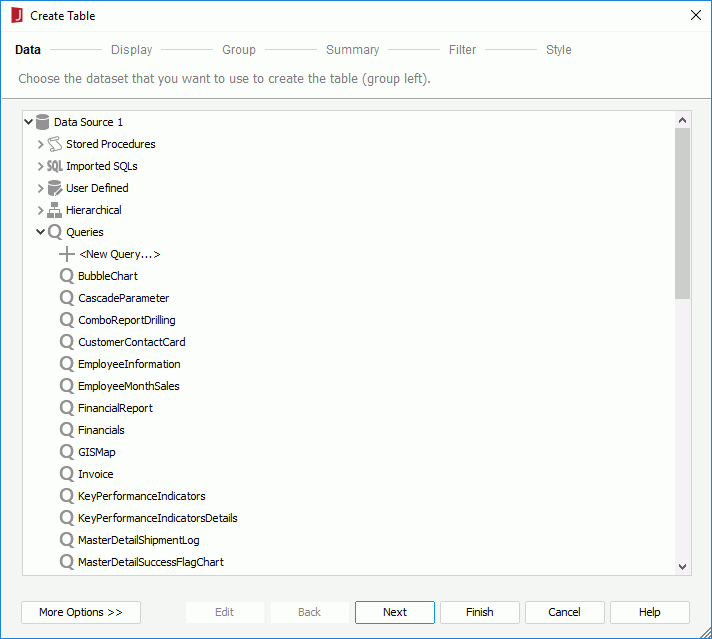
If the predefined data resources are not what you want, you can click the first item in the corresponding resource node to create one. When a query is selected, click the Edit button to modify the query if required. Then a new dataset based on the selected data resource is created in the page report.
If you want to use an existing dataset in the current page report to create the table, click the More Options button and then:
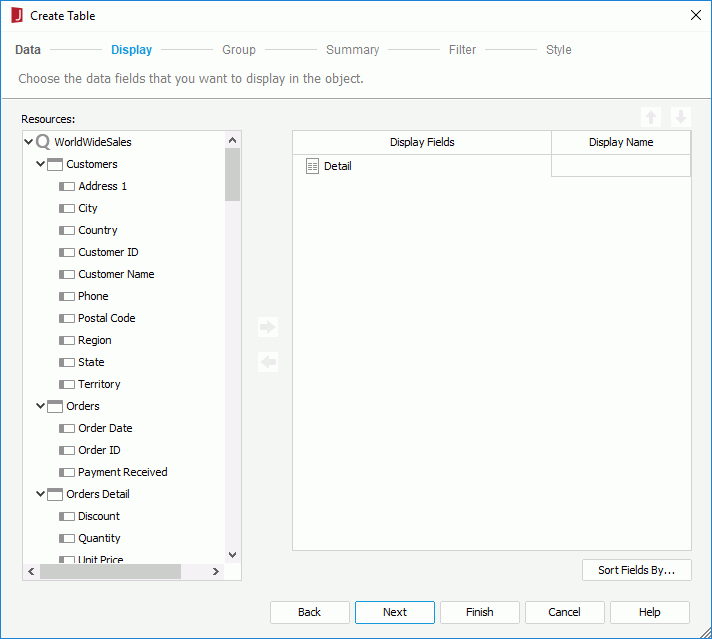
The Resources box lists all the DBFields in the specified data resource, as well as the formulas and parameters that are valid to these DBFields in the current catalog. You can use them as detail fields in the table.
To add a detail field, select an object in the Resources box and click  or drag and drop it from the Resources box to the right box; to remove an unwanted detail field, select it and click
  or drag and drop it to the Resources box. You can make use of
  and
and  to adjust the display order of the detail fields in the table. By default the display names of the added objects will be used to label the corresponding detail columns; to edit the label for a detail column, click in the Display Name text box and enter a new name. If needed, click the Sort Fields By button to specify in which manner to sort the detail values.
Tip: If you are creating a summary table, the detail columns for the added detail fields will not be shown after the table is generated by default. If you want to show the detail columns in a summary table, when the table is created:
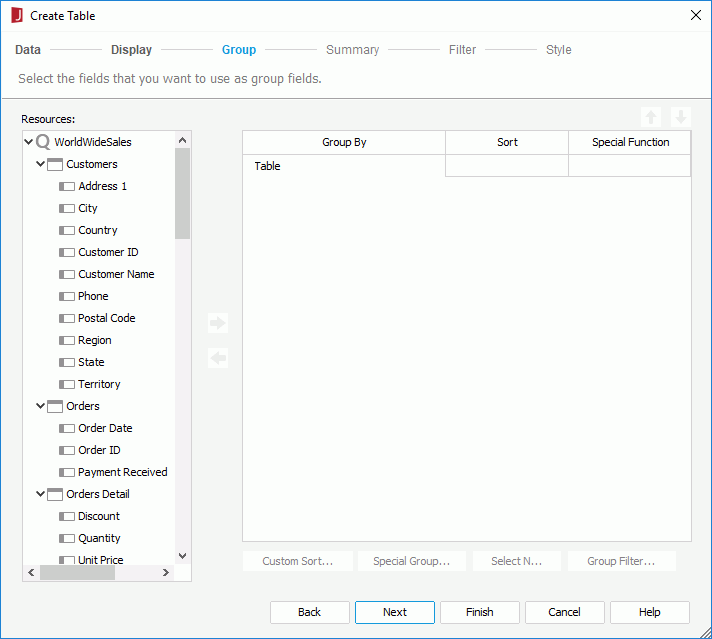
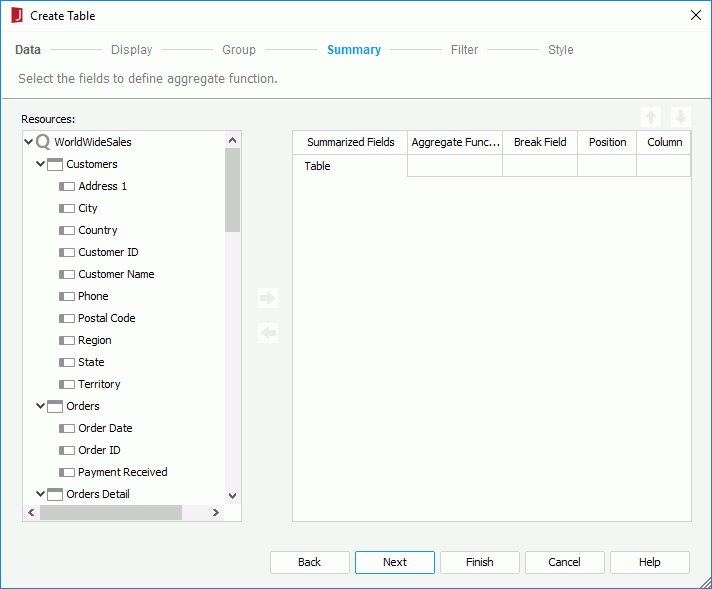
The Resources box lists all the DBFields in the specified data resource, as well as the formulas that are valid to these DBFields in the current catalog. You can create summaries based on these objects in the table.
To add a summary, in the right box, select the group to which the summary will be applied (if you select Table, it will be based on the whole dataset), select an object in the Resources box and click  or drag and drop it to the right box, then specify the aggregate function as required. You can add several summaries for any group level. When the table is created, JReport will automatically give the summaries proper name labels to help you clarify the meaning of the numbers. If a summary is not required, select it and click
  or drag and drop it to the Resources box. You can make use of
  and
and  to adjust the display order of the summaries in the current group or move a summary to another group. The Position and Column options work together to determine the positions of the summaries in the table.
The summaries created from the Summary screen will be added to the current catalog as static summaries even when identical summaries already exist. Therefore, it is better not to create summaries here, instead you can add dynamic summaries to the catalog and drag and drop the dynamic summaries into the table after it is created.
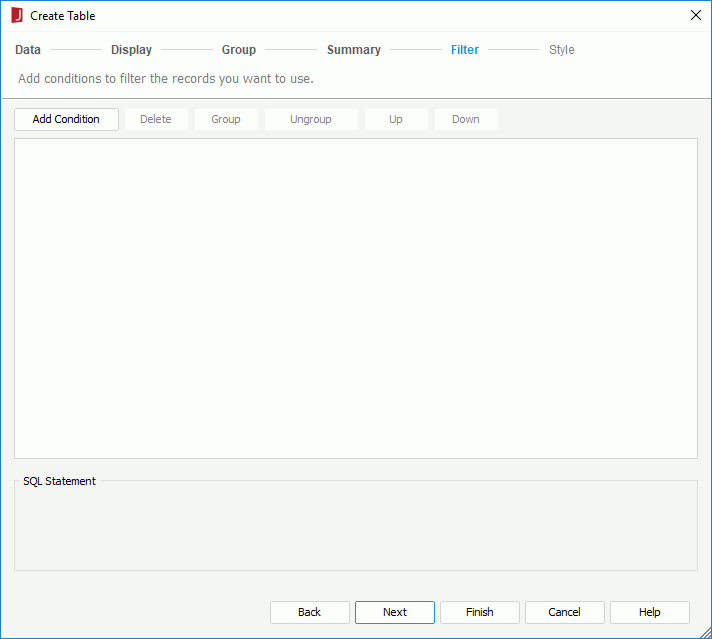
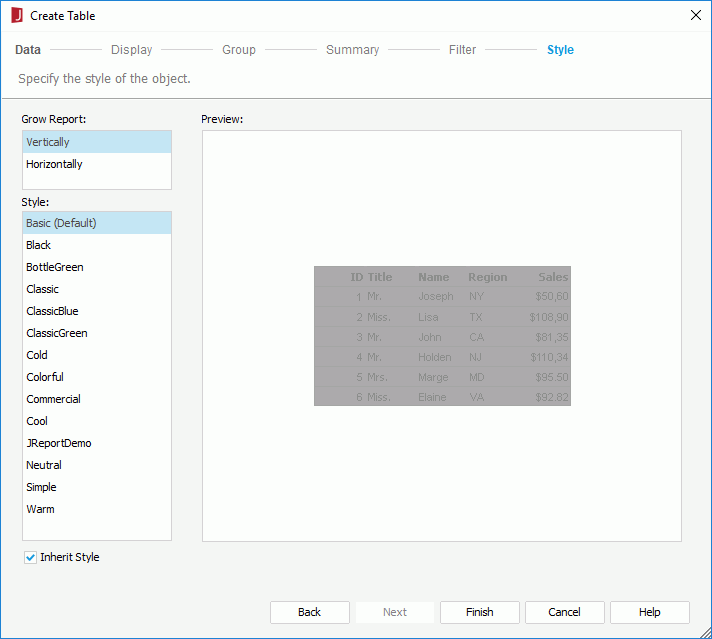
In the Grow Report box, select whether to place the table vertically or horizontally. In the Style box select the style of the table. When you have specified to insert the table into a banded object, by default the table will inherit its parent's style. If you want to apply another style to the table, uncheck the Inherit Style option and then select the required style from the Style box.
If you have used the menu tab command to insert the table and selected a panel in a banded object as the table destination, after finishing the wizard, you need to click the mouse button in the destination once again in order to insert the table there.
Notes: