 Previous Page Next Page
Formatting the Stock in a Stock Chart
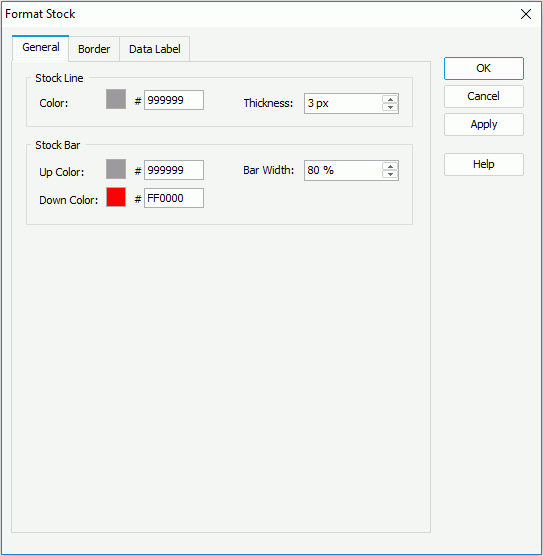
- Right-click any stock line in the stock chart, and then click Format Stock on the shortcut menu to bring up the Format Stock dialog.

- In the General tab, set the color and thickness of the stock lines (to change the color, click the color image and select a color from the color palette or input the hexadecimal value of a color directly in the text box). If the chart is a Open-High-Low-Close stock chart, you can specify the up color to indicate that the opening price is lower than the closing price, the down color to indicate that the opening price is higher than the closing price, and the width of the stock bars.
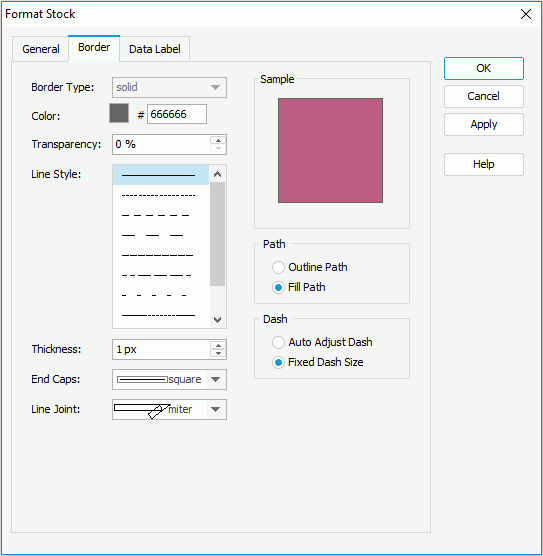
- In the Border tab, set the border mode for the stock bars, including the border style, color, transparency, line style, thickness, end caps style, and line joint mode. You can also specify whether the border is to be outlined, and whether or not to automatically resize the border dashes if the border is drawn with dashes. The specified border properties take effect only when the Border property of the chart paper is set to true in the Report Inspector.

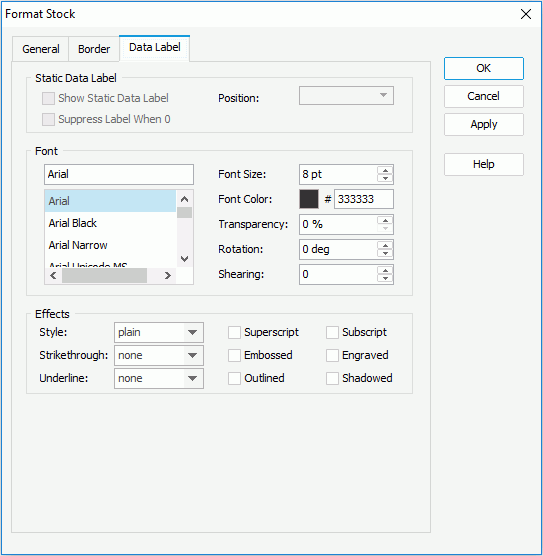
- In the Data Label tab, set the font formats and effects of the data labels on the stock.

- Click OK to accept the changes and close the dialog.
 Previous Page Next Page
 Previous Page Next Page


