 Previous Page Next Page
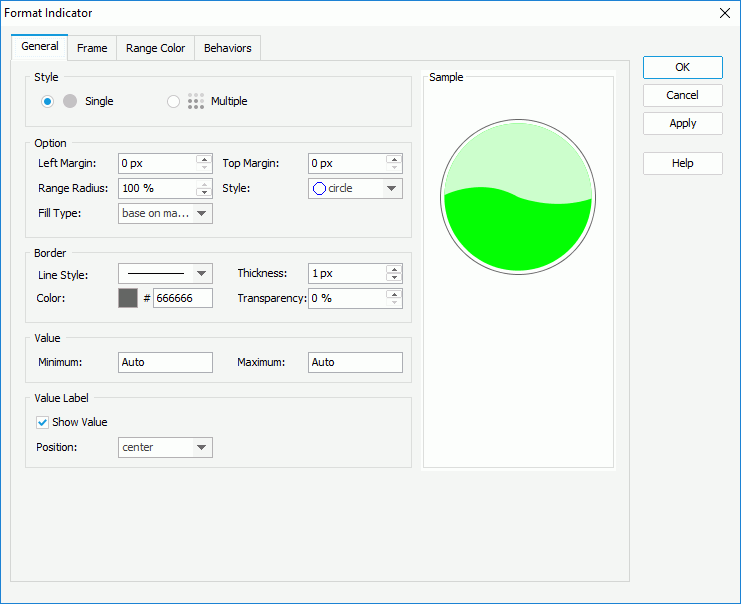
In the Style box, specify to use an indicator or multiple indicators to show each value in the chart.
In the Option box, set the left margin, top margin, range radius and the shape of the indicators, and how to fill the indicators. You can specify to fill the whole indictor or portion of the indicators calculated based on the the maximum value in the Value box. When a value in the chart is less than the minimum value, the indicator will not be filled. When a value in the chart is greater than the minimum value, the value divided by the maximum value you specify will be the portion to be filled.
In the Border box, set the line style, the thickness, the color and transparency for borders of the indicators.
In the Value box, the maximum and minimum values displayed on the chart. The default value is Auto, which means using the actual minimum and maximum values in the chart. You can also specify the values by yourself. Not available when the value of the indicator chart is Boolean or String type.
In the Value Label box, specify whether to show the values of the indicators and the position relationship of the values and the indicators.
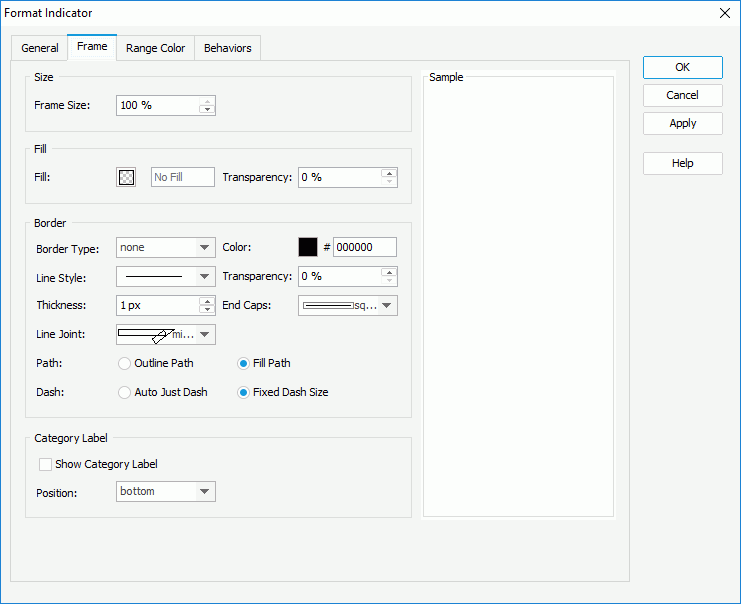
In the Size box, specify the size of the frame.
In the Fill box, specify the color and the transparency of the color to fill the frame.
In the Border box, specify the properties for borders of the frame, including the type, color, line style, transparency, thickness, ending style, line joint style, fill pattern and dash size.
In the Category Label box, check Show Category Label to show the category labels for the indicators, which display the category value each indicator represents.
 in the image cell, then browse to select the required image in the displayed dialog).
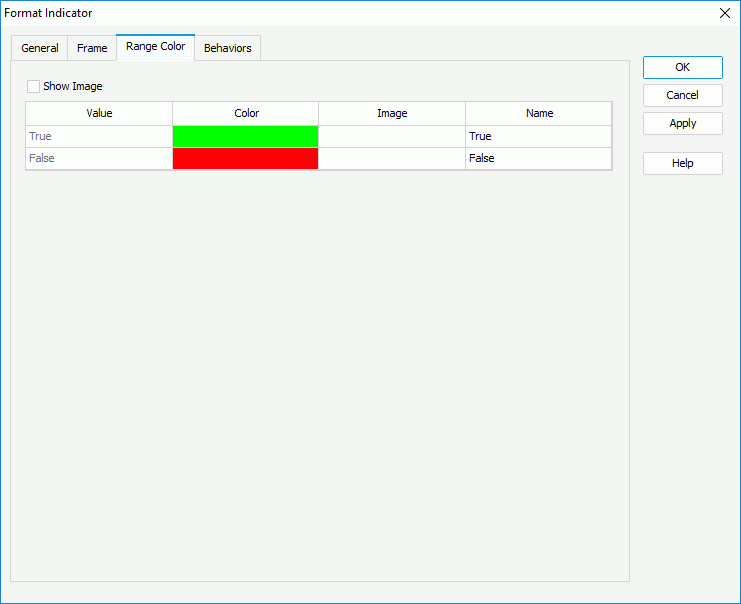
 or
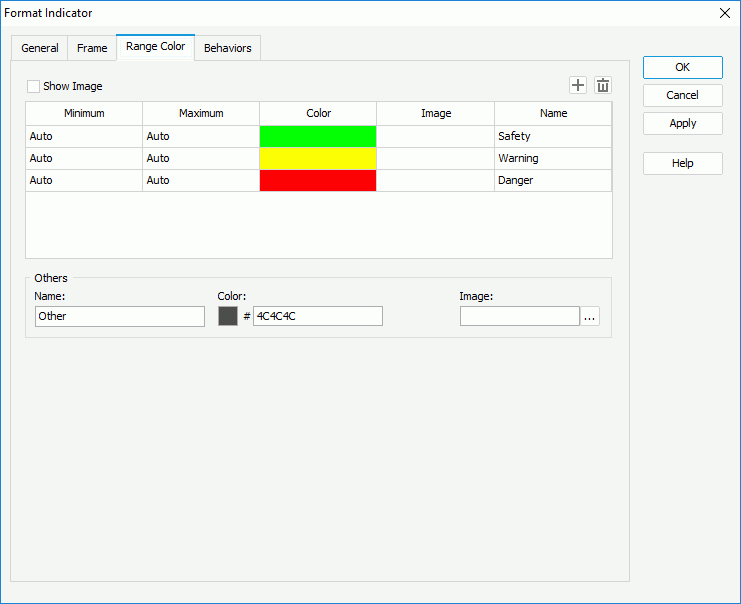
or  to add or delete a value range. In the Others box, specify the name and color for values that do not fall into any of the defined ranges (to change the color, click the color image and select a color from the color palette or input the hexadecimal value of a color directly in the text box). If you want to use images to represent the values, check Show Image and specify the image for each value range and the Others value group respectively.
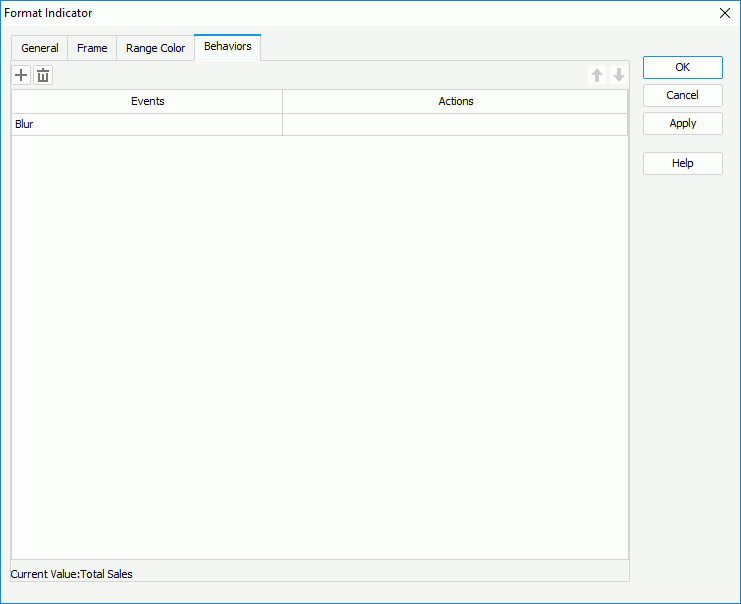
Select a trigger event from the drop-down list in the Events column, then click in the Actions column and click  that appears in the text box. In the Web Action List dialog, bind a web action to the indicators the same as you do to a label in the library component, which will be triggered when the specified event occurs on the indicators. The web actions you can bind include Parameter, Filter, Sort, Change Property and Send Message.
To add more web behaviors, click  and define them as required; if a web behavior is not required, select it and click
  . Click
  or
or  to adjust the order of the behaviors, then at runtime when an event that has been bound with more than one action happens, the upper action will be triggered first.