 Previous Page Next Page
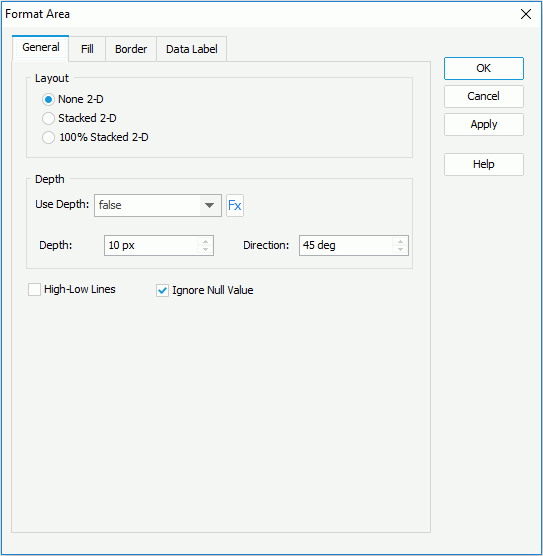
For a 2-D area chart, if you want to add a 3-dimensional effect to the areas, set the Use Depth option to true and specify the depth and direction as required. If the chart uses a query resouce as the data resource, you can use a formula to control the Use Depth option. You can also set to show the lines that represent the data categories by checking High-Low Lines.
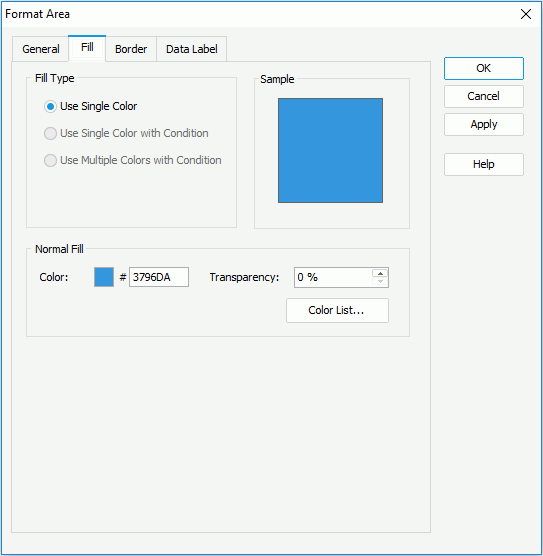
If you select Use Single Color as the fill type, specify the color and the transparency of the color schema to fill the current area, that is the area you have right-clicked on to open the Format Area dialog (to change the color, click the color image and select a color from the color palette or input the hexadecimal value of a color directly in the text box). To specify the color pattern for each area in the area chart, click the Color List button and customize the color patterns in the Color List dialog.
If you select Use Multiple Colors with Condition as the fill type (only applied to Area 2-D and Area 3-D types), specify the conditions and the color pattern bound with each condition respectively. For details, refer to Adding Conditional Color Fills to Charts.
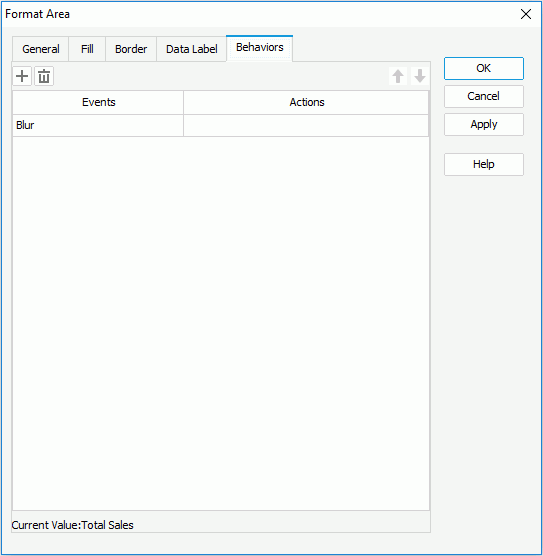
Select a trigger event from the drop-down list in the Events column, then click in the Actions column and click  that appears in the text box. In the Web Action List dialog, where you can bind a web action to the areas the same as you do to a label in the library component, which will be triggered when the specified event occurs on the areas. The web actions you can bind include Parameter, Filter, Sort, Change Property and Send Message.
To add more web behaviors, click  and define them as required; if a web behavior is not required, select it and click
  . Click
  or
or  to adjust the order of the behaviors, then at runtime when an event that has been bound with more than one action happens, the upper action will be triggered first.
Notes: